
Breakout Swing Trading Strategy is a powerful method used by savvy traders to identify and capitalize on sharp price movements in financial markets. This strategy focuses on entering trades when a stock or asset breaks through a key support or resistance level—often signaling the beginning of a strong trend. For beginners and experienced traders alike, understanding how to use this strategy effectively can lead to consistent profits with manageable risk. In this guide, we’ll explore what breakout swing trading is, how it works, the tools you need, and how to implement it step-by-step to maximize your trading success.
Table of Contents
What is a Breakout in Trading?
A breakout occurs when the price of a stock, index, or asset moves above a resistance level or below a support level with increased volume. This movement often signals a new trend or a continuation of an existing trend.
Breakouts typically indicate a change in supply and demand and provide traders with an opportunity to enter the market at the beginning of a potential price movement.
Understanding Swing Trading
Swing trading is a type of trading that focuses on capturing short- to medium-term gains in a stock or any financial instrument over a few days to several weeks.
Swing traders use technical analysis to identify opportunities where price momentum is likely to continue for a short period. This type of trading requires patience, discipline, and a good understanding of market trends.
What is Breakout Swing Trading Strategy?
Breakout Swing Trading Strategy is a trading approach that involves entering a trade when the price of a stock or asset breaks through a defined resistance or support level with high volume. This breakout often signals the start of a strong price trend, offering traders an opportunity to ride the momentum for short to medium-term gains.
The strategy is rooted in technical analysis, using tools like trendlines, moving averages, and volume indicators. It helps traders capture quick profits during price surges while managing risks with stop-loss orders and proper entry/exit timing.
Why Use Breakout Swing Trading Strategy?
- Captures Strong Price Movements: Capitalizes on sudden surges or drops after price breaks key support/resistance levels.
- Maximizes Short-Term Gains: Ideal for traders aiming to profit within days to weeks.
- Based on Technical Signals: Uses charts and volume data to time entries accurately.
- Built-In Risk Management: Easily incorporates stop-losses near breakout points.
- Supports Momentum Trading: Aligns with trending market behavior for consistent trades.
- Quick Decision Making: Reduces emotional trading through predefined patterns.
Key Tools and Indicators for Breakout Swing Trading Strategy
- Support and Resistance Levels
- Identify key levels where price frequently reverses.
- Moving Averages (50-day, 200-day)
- Use for trend confirmation.
- Volume
- A true breakout is often accompanied by a spike in volume.
- Bollinger Bands
- Help identify volatility and squeeze setups.
- Relative Strength Index (RSI)
- Measure momentum and spot potential overbought/oversold conditions.
- MACD (Moving Average Convergence Divergence)
- Confirm breakout momentum and trend direction.
How to Identify a Real Breakout
- Volume Confirmation
- Ensure the breakout is supported by high volume.
- Retest of Breakout Level
- Price should ideally retest the breakout level and hold.
- No False Breakouts
- Avoid entering trades on sudden spikes that fall back quickly.
- Price Closes Outside the Level
- Daily or weekly close outside the support/resistance level adds strength to the breakout.
Step-by-Step Guide to Using Breakout Swing Trading Strategy
1. Identify Key Support and Resistance Levels
Use historical price charts to spot significant support (lower) and resistance (upper) zones where price has reversed before. These are potential breakout points.
2. Analyze Volume for Confirmation
A true breakout is typically accompanied by a surge in volume. Watch for high trading volume to validate the breakout and reduce false signals.
3. Use Technical Indicators
Incorporate tools like Moving Averages, RSI, MACD, and Bollinger Bands to strengthen your analysis and confirm potential breakout setups.
4. Wait for a Clear Breakout
Do not act on assumptions. Wait for the price to close above resistance (for long positions) or below support (for short positions) on strong volume.
5. Plan Your Entry Point
Enter the trade just after the confirmed breakout candle closes. You may also wait for a retest of the breakout level for safer entry.
6. Set Stop-Loss Orders
Place a stop-loss just below the breakout level (for long) or above it (for short) to minimize risk if the breakout fails.
7. Define Your Profit Target
Use the distance between the support and resistance level to set a realistic profit target. Or, follow the trend using a trailing stop.
8. Monitor and Adjust
Keep an eye on market news, volume shifts, or reversal signals. Adjust your stop-loss and exit points based on price action.
Examples of Breakout Swing Trading Strategy
Example: Breakout Swing Trading Strategy – HDFC Bank
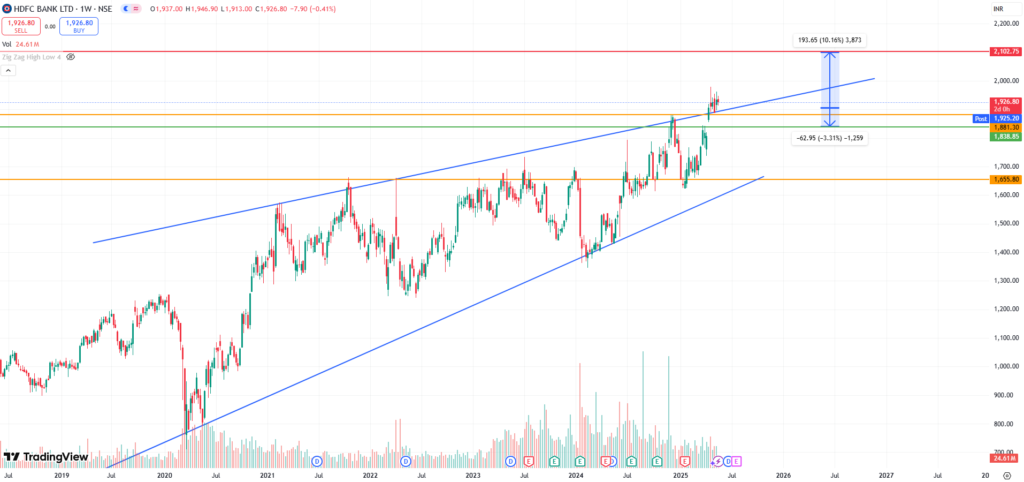
- Trend Direction: HDFC Bank stock has been trading in a strong uptrend.
- Breakout Confirmation: The stock broke above a key resistance level and triangle pattern, signaling a potential breakout opportunity.
- Entry Point: Entry is planned at ₹1,900, right after the confirmed breakout.
- Target Price: The price target is ₹2,100 — aiming for a 10% return.
- Stop-Loss Placement: A stop-loss is set at ₹1,880 — limiting potential loss to 3%.
- Risk-Reward Ratio: This trade offers a favorable 3:1 risk-to-reward ratio (10% upside vs. 3% downside).
- Orange Line: Represents the resistance level (previous breakout point).
- Green Line: Indicates the stop-loss level, just below the resistance.
- Red Line: Marks the target price for booking profits.
- Strategy Insight: This setup follows the breakout swing trading strategy, aiming to capitalize on strong momentum post-breakout.
Example: Breakout Swing Trading Strategy – AXIS Bank
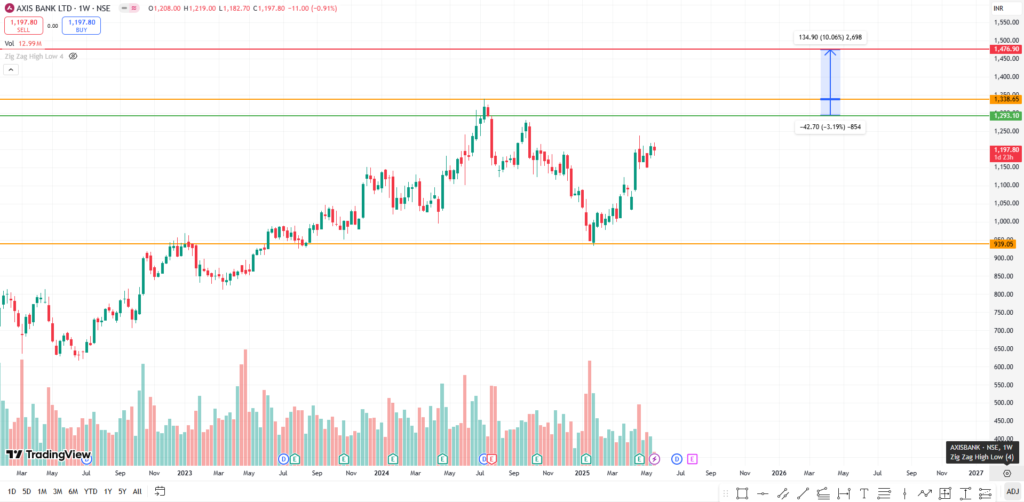
- Trend: Axis Bank stock is currently in an uptrend with positive momentum.
- Current Price: Trading at around ₹1,200.
- Resistance Level: Identified at ₹1,330, marked with an orange line.
- Breakout Requirement: Needs to rise 130 points from current price to break resistance.
- Entry Point: Enter the trade after a confirmed breakout above ₹1,330 with strong volume and candle close.
- Target Price: Set at 10% above resistance, approximately ₹1,470. Marked with a red line.
- Stop Loss: Placed 3% below resistance, around ₹1,290, to limit risk. Marked with a green line.
- Strategy Used: This follows the Breakout Swing Trading Strategy, ideal for short- to medium-term profits.
- Confirmation Needed: Look for volume surge and a strong breakout candle before entering.
- Risk Management: Always apply stop-loss and follow proper position sizing.
Tips for Maximizing Profits with Breakout Swing Trading Strategy
- Always Use Stop Losses: Protect capital against false breakouts.
- Avoid Trading During News Events: Can cause erratic price behavior.
- Don’t Chase Breakouts: Enter only on confirmation.
- Use a Trading Journal: Learn from each trade.
- Backtest Your Strategy: Check past performance before real trades.
- Stick to Your Plan: Discipline leads to consistency.
Risks and Challenges
- False Breakouts: Can trap traders and lead to losses.
- Whipsaw Movements: Sudden reversals may hit stop-losses.
- Overtrading: Waiting for perfect setups is key.
- Emotional Trading: Greed and fear can impact decision-making.
When NOT to Use This Strategy
- In a sideways or choppy market.
- When major news or earnings are expected.
- On low volume stocks.
- Without proper technical confirmation.
Breakout Swing Trading Strategy is a robust method for short- to medium-term traders looking to capitalize on strong price movements. With the right setup, technical tools, discipline, and risk management, this strategy can deliver consistent profits. Always remember to test your strategy, refine your approach, and avoid emotional decisions.
Frequently Asked Questions (FAQs)
Q1: Is breakout strategy profitable?
Yes, the breakout strategy can be profitable if used with proper risk management, volume confirmation, and trend direction analysis.
Q2: How to master breakout trading?
Master breakout trading by studying chart patterns, confirming volume, setting stop-losses, backtesting strategies, and staying disciplined with market trends.
Q3: Which indicator is best for a breakout strategy?
The best indicator for a breakout strategy is the Bollinger Bands, along with volume spikes and support-resistance levels confirmation.