
Fibonacci retracement is one of the most popular tools in technical trading — and for good reason. Traders across the world rely on Fibonacci levels to spot potential pullbacks, plan entries, and manage risk before the next big price move. Whether you trade stocks, forex, crypto, or commodities, Fibonacci retracement can help you identify where a trend is likely to pause, correct, or continue.
But many beginners use Fibonacci lines like random markers on a chart, without really understanding what they mean — and that’s when the tool stops working. In reality, Fibonacci retracement is based on mathematical ratios found repeatedly in nature, market structure, and human behavior. When price retraces to key Fibonacci levels, traders watch closely for clues of buying or selling pressure.
In this guide, you’ll learn what Fibonacci retracement is, how it works, how to draw it correctly, and how traders combine it with other tools to find high-probability setups. Used with discipline and context, Fibonacci retracement can transform the way you read charts — helping you trade with logic instead of guesswork.
What Is Fibonacci Retracement and How Does It Work in Trading?
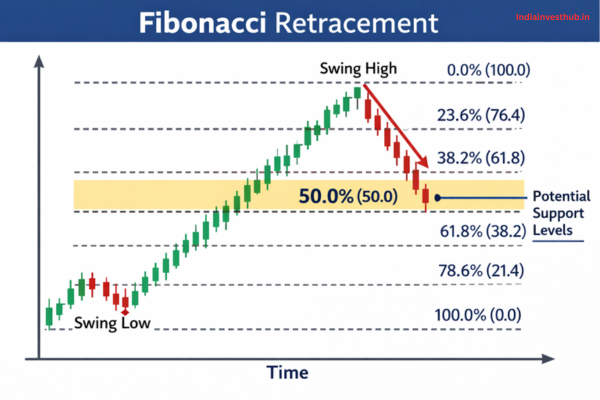
Fibonacci Retracement is based on the famous Fibonacci sequence — 0, 1, 1, 2, 3, 5, 8… — where each number is the sum of the previous two. Ratios that come from this sequence, especially 61.8% (the “golden ratio”), occur frequently in nature, architecture, and markets. In trading, Fibonacci Retracement levels are used to identify potential areas where a trending price might pull back before continuing in the original direction. Traders measure a move from swing low to swing high (or vice versa), and the retracement tool automatically plots key levels where price may react.
Markets repeatedly show that pullbacks tend to retrace part of a move rather than reversing entirely, and these partial retracements often fall near Fibonacci-derived percentages — which is why so many traders watch these levels. And when many traders watch the same levels, liquidity and orders cluster there, which helps reinforce their reliability.
Key Fibonacci Levels Explained: 23.6%, 38.2%, 50%, 61.8% and 78.6%
While Fibonacci math creates many ratios, trading focuses mainly on these:
- 23.6% — shallow retracement, often in strong trends
- 38.2% — moderate healthy pullback
- 50% — not a Fibonacci number, but widely used due to historical relevance
- 61.8% — the golden ratio, highly watched
- 78.6% — deep retracement level before full reversal
According to Investopedia, these levels often act as psychological reaction areas because traders place orders there — not because the market follows mathematics, but because traders do. The 61.8% level especially attracts attention due to its historical significance in both mathematics and financial price behavior.
How to Draw Fibonacci Retracement Correctly on Price Charts:
Many mistakes with Fibonacci Retracement come from drawing it incorrectly. The tool must always be anchored to a clear swing high and swing low:
- In an uptrend, draw from swing low to swing high
- In a downtrend, draw from swing high to swing low
The key is clarity. Swings should be obvious on the timeframe being traded. Professional traders also prefer aligning Fibonacci levels with trend direction, not against it, because statistics show trend-aligned trades have higher continuation probability than counter-trend attempts (Journal of Trading).
Using Fibonacci Retracement to Identify High-Probability Entry Points:
Fibonacci Retracement is most powerful when used to identify pullback entries inside a trend. For example, when price trends up strongly, then retraces to the 38.2% or 61.8% level and shows bullish confirmation, many traders see that as a high-probability continuation setup. This approach works because it combines momentum with discount pricing — entering on retracements rather than chasing tops.
Studies on price behavior show that markets frequently move in waves, with pullbacks averaging 30–60% of the prior leg depending on volatility and asset class (CFA Institute educational materials). That’s effectively what Fibonacci is helping visualize.
How to Combine Fibonacci Retracement with Support and Resistance:
On its own, Fibonacci Retracement is helpful — but when a Fibonacci level aligns with horizontal support or resistance, the area becomes far more significant. Traders call this confluence.
For example:
- A 61.8% retracement landing at a prior breakout level
- A 50% retracement aligning with a weekly demand zone
- A 38.2% retracement lining up with a round number or psychological level
Support and resistance reflect trader memory and order clustering, and when multiple tools highlight the same price zone, probability increases because more participants react there.
The Psychology Behind Support and Resistance in Financial Markets
Fibonacci Retracement in Uptrends vs Downtrends: What Changes?
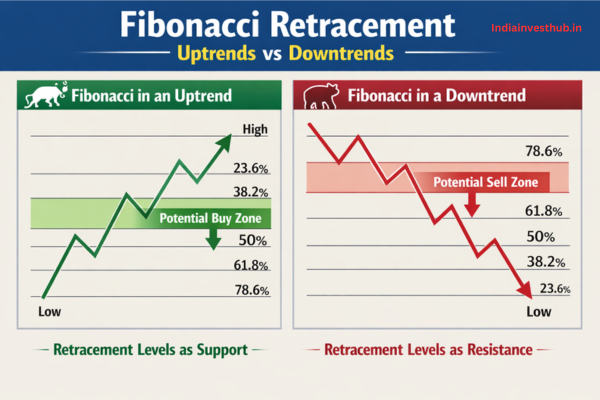
The logic is similar in both, but mindset shifts:
- In uptrends, traders look to buy pullbacks to Fibonacci levels
- In downtrends, traders look to sell rallies into Fibonacci resistance levels
The structure matters far more than the tool. Trying to buy deep retracements in strong downtrends, or short shallow retracements in strong uptrends, is usually lower probability because trend direction reflects dominant institutional behavior.
Common Mistakes Traders Make with Fibonacci Retracement:
Some of the biggest errors include:
- Drawing Fibonacci on unclear swing points
- Forcing Fibonacci levels onto charts where they don’t fit
- Using Fibonacci without trend context
- Treating Fibonacci levels as guaranteed reversal zones
- Ignoring volume and market structure
Behavioral finance research shows retail traders often anchor emotionally to chart tools instead of reading price objectively, leading to overconfidence and poor execution (Journal of Behavioral Finance). Fibonacci should guide — not control — decisions.
Best Indicators to Use with Fibonacci Retracement (RSI, MACD, Moving Averages):
Fibonacci Retracement becomes even more useful when combined with momentum and trend indicators, such as:
- RSI — to spot overbought/oversold conditions at Fibonacci levels
- MACD — to confirm trend continuation during retracements
- Moving Averages — especially the 50- and 200-period, as institutions watch them closely
When a Fibonacci level aligns with a bullish RSI divergence or a rising moving average, traders see higher-probability continuation setups because multiple technical elements support the same idea.
Pro Trading Strategies Using Fibonacci Retracement (With Risk Management Tips):
Some professional-style approaches include:
Trend Pullback Entry
- Identify clear trend
- Wait for pullback to 38.2–61.8%
- Look for structure break or confirmation candle
- Place stop-loss beyond the next Fibonacci level or swing
- Target prior high/low or extension levels
Multi-Timeframe Confirmation
- Draw Fibonacci on higher timeframe
- Fine-tune entries on lower timeframe
- Use volume or price action to confirm reaction
Risk management is essential. Because no Fibonacci level guarantees reversal, stops must be placed beyond invalidation points — not emotionally. Data consistently shows that traders who predetermine stop-loss levels perform better than those who trade without protective exits (CFA Institute).
FAQs – Fibonacci Retracement
Q1: Is Fibonacci Retracement reliable?
👉It’s a probability tool — reliability increases with trend alignment and confluence.
Q2: Which Fibonacci level works best?
👉61.8% is highly watched, but effectiveness depends on market context.
Q3: Does Fibonacci work in all markets?
👉Yes — it’s used across stocks, forex, commodities, and crypto.
Q4: Is Fibonacci predictive?
👉No — it identifies potential reaction zones, not certainties.
Q5: Should beginners use Fibonacci?
👉Yes, but only with structure, confirmation, and proper risk control.
Conclusion:
Fibonacci retracement is powerful not because it predicts the future, but because it helps traders organize price action into logical decision zones. When price pulls back into key Fibonacci levels—especially when they align with support, resistance, trends, or volume—you gain a framework for planning smarter entries, setting realistic targets, and managing risk. Used correctly, Fibonacci retracement shifts trading from guesswork to probability.
But like any tool, success depends on context, discipline, and patience. Avoid forcing Fibonacci onto every chart and always wait for confirmation. Over time, you’ll start recognizing how consistently markets react around these levels.
Are you using Fibonacci retracement with a clear trading plan?


