
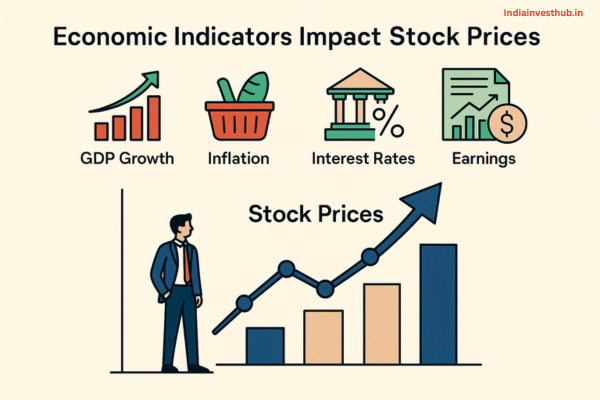
Economic Indicators play a major role in shaping stock market movements, even when investors don’t consciously track them every day. Behind every market rally, correction, or sideways phase, there is usually a mix of economic data influencing investor expectations. From GDP growth and inflation numbers to interest rates and corporate earnings, these indicators act like signals that guide how money flows into or out of stocks.
According to long-term data from global and Indian markets, stock indices tend to rise during periods of strong economic expansion and fall during slowdowns or tightening monetary conditions. For example, historical Sensex data shows that long-term equity returns have averaged around 12–14% annually, closely tracking India’s economic growth over decades. Investors who understand how economic indicators work don’t try to predict markets perfectly—but they gain clarity on why markets move the way they do.
This guide is written for investors who want to know how economic indicators impact stock prices, explained in simple terms, with real-world relevance and practical application.
What Are Economic Indicators?
Economic Indicators are statistical data points released by governments, central banks, and financial institutions to measure the health of an economy. These indicators help investors understand whether the economy is expanding, slowing down, or facing stress.
They are broadly classified into:
- Leading indicators (predict future trends)
- Lagging indicators (confirm trends after they occur)
- Coincident indicators (move along with the economy)
Stock markets are forward-looking by nature. Prices often move before economic data fully reflects reality, based on expectations. That’s why markets sometimes rise even when current data looks weak—or fall despite strong numbers.
The Ultimate Guide to Stock Market Investing for Beginners
How GDP Growth Influences Stock Market Performance
Economic Indicators like GDP (Gross Domestic Product) show how fast an economy is growing. When GDP growth is strong:
- Companies sell more products and services
- Revenues and profits increase
- Business confidence improves
- Stock prices generally rise
In India, periods of 6–8% GDP growth have historically supported long-term stock market rallies. Sectors like banking, infrastructure, capital goods, and consumption benefit the most during high-growth phases.
However, extremely high GDP growth can also trigger inflation or policy tightening, which markets start pricing in early. Investors track GDP trends not as a buy/sell signal, but as a directional guide.
Inflation and Stock Prices – Winners, Losers & Market Reactions
Economic Indicators related to inflation (like CPI and WPI) directly affect stock prices. Moderate inflation is healthy, but high inflation hurts markets because:
- Costs rise for companies
- Profit margins shrink
- Central banks raise interest rates
Certain sectors react differently:
- Banks & financials may benefit initially
- FMCG can struggle due to input cost pressure
- IT exporters may benefit if currency weakens
- Consumer discretionary often underperforms
Markets usually fall when inflation surprises on the upside, not because inflation exists, but because it changes future interest-rate expectations.
Interest Rates and Their Direct Effect on Stock Valuations
Economic Indicators set by central banks—especially interest rates—have one of the strongest impacts on stock prices.
When interest rates:
- Fall → borrowing becomes cheaper → stock valuations rise
- Rise → loans become expensive → future profits are discounted more → stock prices fall
Rate-sensitive sectors include:
- Banking
- Real estate
- Auto
- Infrastructure
Long-term market data shows that major corrections often begin during aggressive rate-hiking cycles. Investors closely follow RBI policy meetings because rate direction matters more than current rate levels.
Employment Data and Its Influence on Market Confidence
Economic Indicators such as employment numbers, unemployment rate, and job creation data reflect consumer strength.
When employment is strong:
- People spend more
- Demand rises
- Corporate earnings improve
Weak employment data signals:
- Lower consumption
- Slower economic growth
- Market caution
In India, job data impacts sectors like FMCG, retail, housing, and banking more than export-oriented sectors. Employment indicators influence market confidence, not just earnings.
Corporate Earnings Reports – The Strongest Market-Moving Indicator
Economic Indicators related to corporate earnings are often the most powerful drivers of stock prices.
Markets care less about headlines and more about:
- Revenue growth
- Profit margins
- Future guidance
- Management commentary
Even during weak economic phases, companies that deliver strong earnings outperform the market. Over time, stock prices follow earnings growth, not news flow.
That’s why long-term investors focus heavily on earnings trends while using macro indicators for context.
Currency Exchange Rates and Export–Import Driven Stocks
Economic Indicators like currency exchange rates affect sectors differently.
When the Indian rupee:
- Weakens → exporters (IT, pharma) benefit
- Strengthens → import-heavy sectors gain
Currency movement impacts:
- Corporate profitability
- Foreign investment flows
- Inflation levels
Markets often react quickly to currency swings because they affect earnings expectations and global competitiveness.
Government Policies, Budget Announcements & Market Movements
Economic Indicators tied to government policy—such as budgets, tax changes, subsidies, and reforms—can create sharp market reactions.
Key policy impacts:
- Infrastructure spending boosts capital goods stocks
- Tax cuts improve corporate profitability
- Regulatory changes affect sector-specific stocks
Markets react not to announcements alone, but to how policies impact future cash flows and earnings.
Global Economic Indicators and Their Spillover Effect on Indian Markets
Economic Indicators from global economies—especially the US—have a spillover effect on Indian stock prices.
Important global indicators include:
- US interest rates
- Global inflation
- Commodity prices
- Recession signals
When global markets turn risk-averse, foreign investors often reduce exposure to emerging markets, impacting Indian equities even if domestic fundamentals remain strong.
How Investors Use Economic Indicators to Time Market Entries and Exits
Economic Indicators help investors:
- Avoid buying aggressively at economic peaks
- Stay invested during recovery phases
- Adjust sector allocation based on macro trends
Smart investors don’t try to predict every data point. Instead, they:
- Track trend direction
- Focus on long-term signals
- Combine indicators with company fundamentals
Indicators help with risk management, not perfect timing.
FAQs – Economic Indicators
Q1: Do economic indicators predict stock prices accurately?
👉No, but they provide direction and context.
Q2: Should beginners track all indicators?
👉No. Focus on GDP, inflation, interest rates, and earnings.
Q3: Why do markets rise even during bad news?
👉Markets price expectations, not current conditions.
Q4: Which indicator matters most?
👉Corporate earnings have the strongest long-term impact.
Conclusion:
Economic Indicators shape stock prices by influencing expectations, confidence, and future earnings rather than short-term emotions. Investors who understand how GDP, inflation, interest rates, employment, earnings, and global trends interact gain a powerful advantage—not by predicting markets, but by staying aligned with long-term economic reality. Instead of reacting to every data release, successful investors use economic indicators as a compass to navigate market cycles with discipline and clarity.
So, are you using these signals to strengthen your investing decisions?


