Money grows slowly at first, then suddenly faster, and this is exactly where CAGR becomes powerful. Many investors start their journey checking yearly returns, but over time they realize yearly returns fluctuate a lot. One year may show 25% growth, another year may show 5%, and sometimes even negative returns. But when looking at the long-term performance, investors want a simple number that tells the real growth story. That number is called CAGR.
It shows how fast an investment grows every year on average, assuming profits are reinvested. According to financial research, Indian stock market indices like Sensex have historically delivered about 11%–14% CAGR over long periods, showing the power of compounding in wealth creation.
Many successful investors rely on CAGR to measure performance because it gives a realistic and smooth growth rate, unlike simple averages that can be misleading. Understanding CAGR helps investors compare investments, track progress, and make better financial decisions.
What is Compound Annual Growth Rate (CAGR)?

CAGR (Compound Annual Growth Rate) is the average annual growth rate of an investment over a specific period, assuming the profits are reinvested every year. It represents the consistent rate at which an investment would grow if it increased at the same rate annually.
In simple terms, CAGR answers one important question:
“If my investment grew at a fixed rate every year, what would that rate be?”
For example:
- Investment value in 2020 = ₹1,00,000
- Investment value in 2025 = ₹2,00,000
The investment doubled, but CAGR tells the yearly growth rate, not just total growth.
CAGR smooths out the volatility and gives the true annual growth rate. This makes it one of the most trusted metrics used by investors, analysts, and financial advisors.
Compound Annual Growth Rate Formula:
The CAGR formula is used to calculate the average annual growth rate of an investment over a specific period, assuming the profits are reinvested every year.
CAGR Formula:
CAGR = (Ending Value / Beginning Value)^(1 / Number of Years) − 1
Explanation of Each Component:
- Ending Value (EV): Final value of the investment
- Beginning Value (BV): Initial value of the investment
- Number of Years (n): Total investment duration
How to Calculate CAGR – Step-by-Step Example
Step 1: Identify the Beginning Value, Ending Value, and Number of Years → Beginning Value = ₹50,000, Ending Value = ₹1,00,000, Number of Years = 5
Step 2: Use the CAGR Formula → CAGR = (Ending Value / Beginning Value)^(1 / Number of Years) − 1
Step 3: Substitute the Values → CAGR = (100000 / 50000)^(1 / 5) − 1
Step 4: Calculate the Result → CAGR = (2)^0.2 − 1 = 1.1487 − 1
Step 5: Convert to Percentage → CAGR = 0.1487 × 100 = 14.87%
Final Result: The investment grew at a CAGR of 14.87% per year.
Real-World CAGR Example from Indian Stock Market:
The Indian stock market is one of the best examples of long-term compounding.
- Sensex average annualized growth rate is about 13.34% CAGR in long-term data.
- Historically, Sensex delivered around 15.9% CAGR between 1979 and 2021, creating massive wealth for investors.
- Over decades, Sensex compounded at nearly 18.6% annually since inception, showing extraordinary long-term growth.
This means ₹1 lakh invested decades ago could grow into crores over time due to CAGR.
This is why long-term investors focus on CAGR instead of short-term returns.
Why CAGR is Important for Investors:
CAGR is extremely important because it provides clarity and realistic expectations.
Here’s why investors rely on CAGR:
1. Shows True Investment Performance
CAGR removes yearly fluctuations and shows actual growth rate.
2. Helps Compare Investments
Investors compare stocks, mutual funds, and assets using CAGR.
Example:
| Investment | CAGR |
|---|---|
| Mutual Fund | 12% |
| Stock | 15% |
| Fixed Deposit | 6% |
The stock is clearly the better investment.
3. Helps in Financial Planning
If you know your investment grows at 12% CAGR, you can estimate future wealth.
Example:
₹1,00,000 invested at 12% CAGR for 20 years becomes ₹9,64,000.
4. Shows Power of Long-Term Investing
Equity markets often deliver 11%–14% CAGR in India, which can significantly grow wealth over time.
This proves long-term investing works.
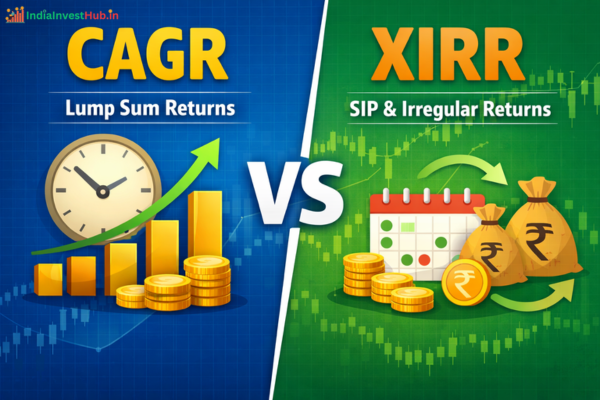
Key Differences of CAGR vs XIRR – Comparison Table
Many investors confuse CAGR and XIRR.
Here is the clear difference:
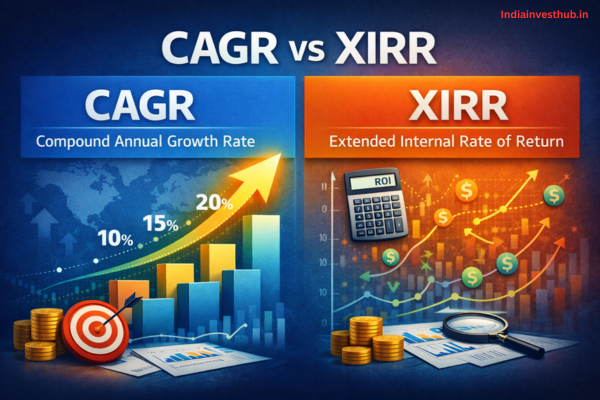
| Feature | CAGR | XIRR |
|---|---|---|
| Definition | Average annual growth rate | Internal rate of return |
| Cash Flow | Assumes single investment | Supports multiple investments |
| Complexity | Simple | Complex |
| Best Used For | Lump sum investment | SIP and multiple cash flows |
| Accuracy | Less accurate for multiple investments | More accurate |
| Example | Stock investment | SIP in mutual funds |
CAGR is ideal when there is only one investment and one ending value.
XIRR is better for SIP investments.
Benefits of Using CAGR in Investing:
CAGR offers several advantages:
1. Easy to Understand
Simple formula and easy calculation.
2. Shows True Growth Rate
It reflects real annual growth.
3. Removes Market Volatility
CAGR smooths fluctuations.
4. Useful for Long-Term Planning
Investors can estimate future wealth.
5. Helps Compare Investments
CAGR helps compare stocks, funds, and assets easily.
Limitations of CAGR:
While CAGR is powerful, it has limitations.
1. Assumes Constant Growth
In reality, investments fluctuate.
2. Ignores Volatility
CAGR does not show ups and downs.
3. Not Suitable for SIP Investments
CAGR works best for lump sum investments.
4. Cannot Predict Future Returns
CAGR shows past performance, not future.
Why CAGR is Important for Long-Term Wealth Creation:

CAGR helps investors understand how wealth grows over time.
Many mutual funds and stocks deliver strong CAGR returns.
For example:
- Some mutual funds delivered over 15% CAGR since inception, showing long-term growth potential.
- Indian equities multiplied investor wealth 13 times in 20 years, highlighting the power of compounding.
This shows how CAGR transforms small investments into large wealth.
When Should You Use CAGR?
Use CAGR in the following situations:
1. Stock Investment Analysis
Compare stock performance.
2. Mutual Fund Performance Evaluation
Check fund growth.
3. Portfolio Performance Tracking
Measure overall investment growth.
4. Long-Term Investment Planning
Estimate future wealth.
5. Business Growth Analysis
Measure company revenue growth.
FAQs – Compound Annual Growth Rate (CAGR)
Q1: What is CAGR in simple words?
👉CAGR is the average annual growth rate of an investment.
Q2: Why is CAGR better than average return?
👉CAGR gives realistic growth rate.
Q3: Is higher CAGR better?
👉Yes, higher CAGR means better investment performance.
Q4: Can CAGR be negative?
👉Yes, if investment loses value.
Q5: Is CAGR useful for SIP?
👉No, XIRR is better for SIP.
Conclusion:
CAGR is one of the most powerful and important metrics every investor must understand. It shows the true annual growth rate of an investment and helps compare different investment options easily. Unlike simple returns, CAGR gives a clear picture of long-term performance and helps investors make better financial decisions. Real-world data shows Indian stock markets delivered around 11%–15% CAGR historically, proving the power of compounding and long-term investing.
Whether you are investing in stocks, mutual funds, or any asset, understanding CAGR helps you track performance, plan your financial goals, and build wealth over time.
So, are you ready to start using CAGR to measure and grow your investments smarter?