Balance Sheet reading is often compared to unlocking a treasure chest of financial secrets. Imagine walking into an auction where two companies are up for bidding. Both look attractive on the surface—glossy presentations, strong sales pitches, and exciting growth narratives. Yet, one company is carrying a mountain of debt hidden under its rug, while the other is sitting on a pile of cash reserves ready to fuel expansion. According to a PwC survey, 61% of investors believe balance sheet strength is a critical factor when evaluating a company’s long-term value.
This demonstrates why knowing how to read a balance sheet isn’t just an accounting skill—it’s an investor’s shield against poor decisions. At Indiainvesthub, we help investors build this shield by making financial analysis both simple and actionable.
Table of Contents
What is a Balance Sheet & Why It Matters for Investors
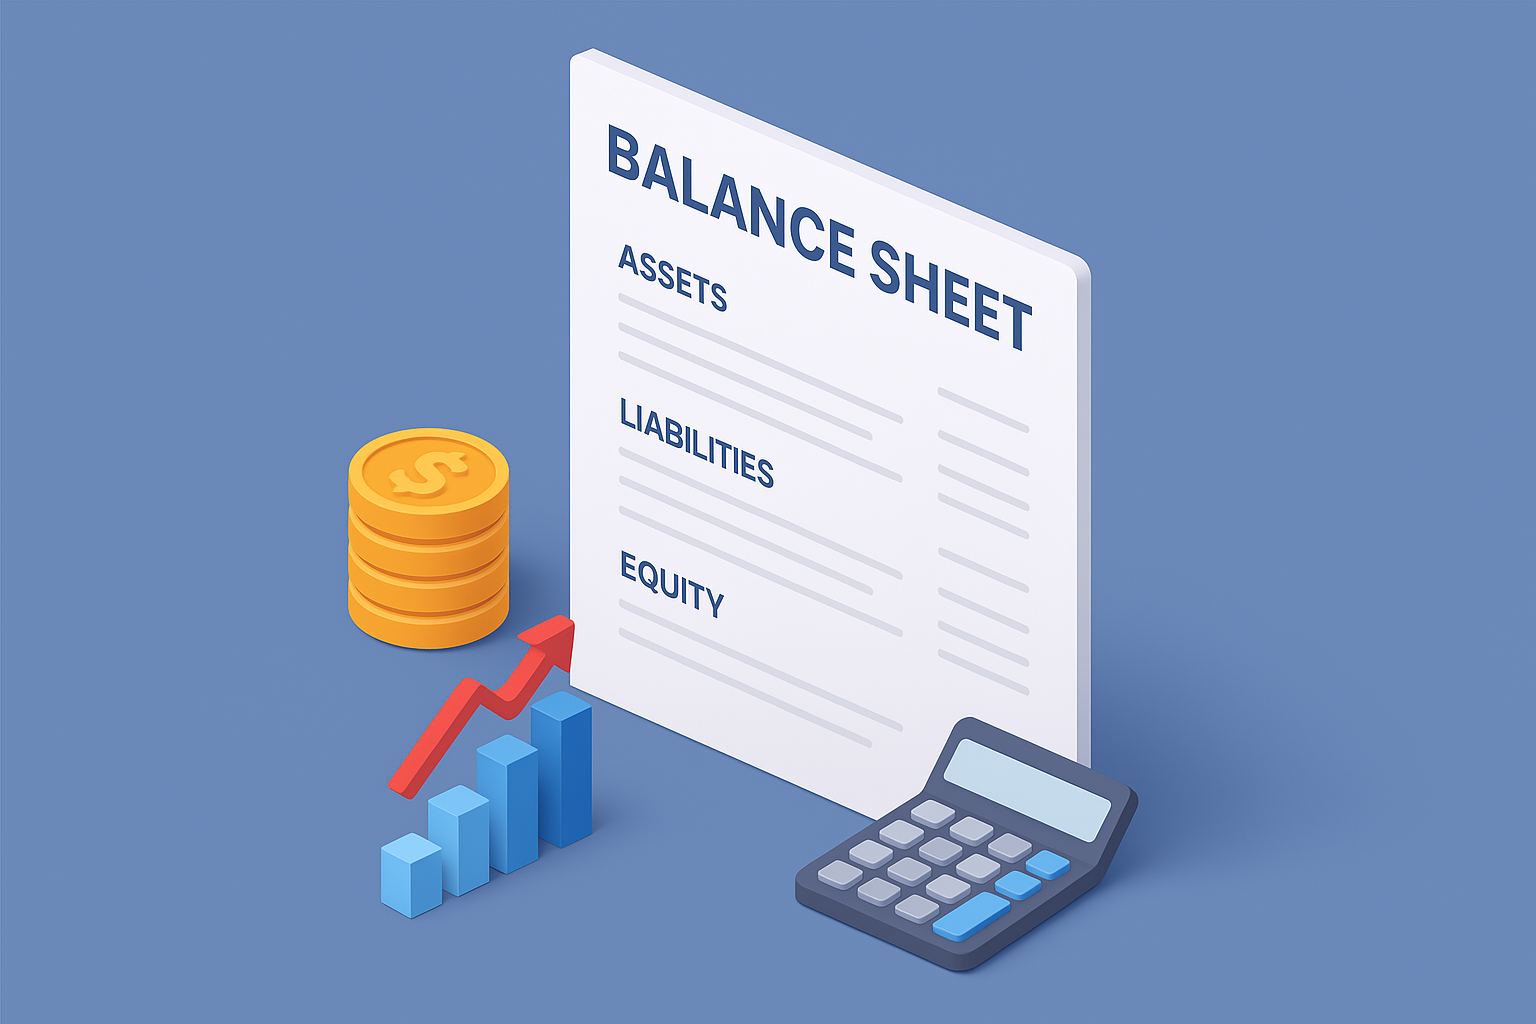
A balance sheet is a snapshot of a company’s financial position at a given time. It outlines three fundamental elements: assets, liabilities, and equity. For investors, the balance sheet matters because it helps answer vital questions: Is the company financially stable? Can it pay its short-term debts? Is it over-leveraged? Unlike income statements that measure performance over time, a balance sheet shows the company’s standing at a specific date, providing clarity about its strength and risks.
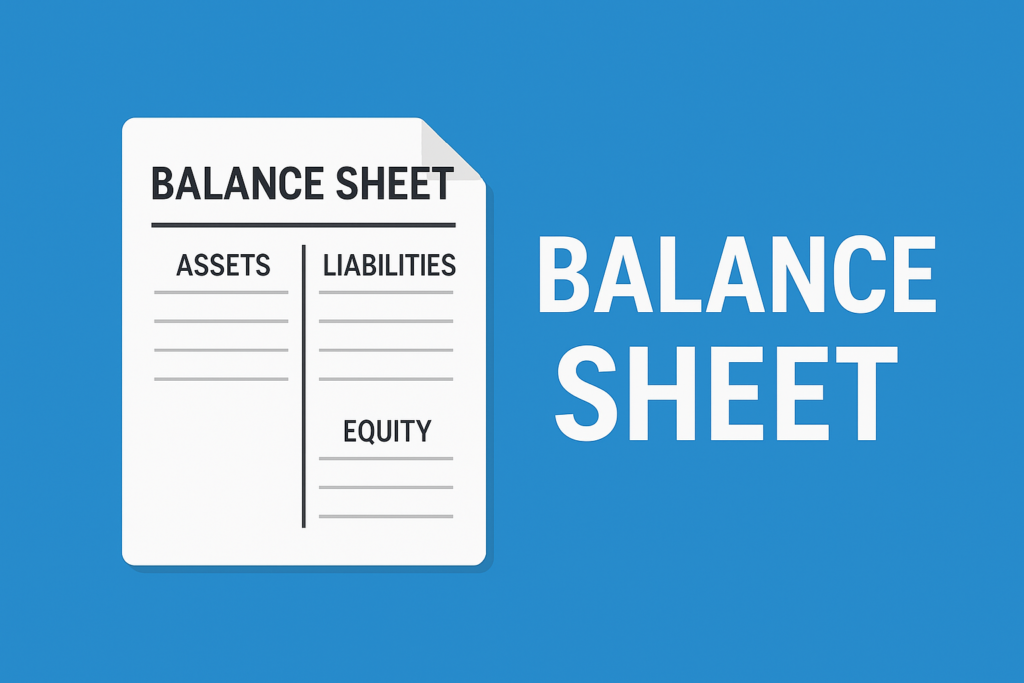
Understanding the Structure: Assets, Liabilities & Equity
The balance sheet follows a simple formula:
Assets = Liabilities + Shareholders’ Equity
- Assets represent what the company owns.
- Liabilities show what it owes.
- Equity reflects the owners’ residual interest after debts are paid.
For investors, this structure allows quick evaluation of financial health.
Current vs Non-Current Assets and Liabilities
To make informed decisions, investors must differentiate between current and non-current items:
- Current Assets: Cash, receivables, and inventory that can be converted into cash within a year. These indicate liquidity.
- Non-Current Assets: Property, machinery, patents—long-term resources used for future growth.
- Current Liabilities: Short-term debts like accounts payable, wages, and accrued expenses due within a year.
- Non-Current Liabilities: Long-term borrowings, bonds, or pension obligations that show future obligations.
This distinction helps investors measure a company’s immediate survival capability versus its long-term stability.
Analyzing Assets – Cash, Inventory, Property & More
Assets tell the story of financial flexibility:
- Cash is king—a high cash reserve boosts liquidity and cushions downturns.
- Inventory shows sales potential but high unsold inventory might indicate weak demand.
- Receivables reflect sales on credit—but delayed collections may signal weak customer management.
- Property & Equipment indicate long-term stability and capacity for expansion.
Investors must analyze how efficiently these assets generate revenue.
Evaluating Liabilities – Debt, Obligations & Short-Term Risks
Liabilities reveal how much pressure a company faces:
- Short-term debt can strain liquidity if cash flow is weak.
- Long-term borrowings show reliance on external financing.
- Accrued expenses and obligations reflect recurring commitments.
Excessive liabilities may weaken creditworthiness and erode shareholder value.
Understanding Shareholder Equity & Retained Earnings
Equity represents ownership value:
- Shareholder Equity is the difference between assets and liabilities.
- Retained Earnings indicate profits reinvested into the company instead of being paid as dividends.
For investors, consistent growth in retained earnings signals sustainable profitability.
Key Ratios Derived from Balance Sheets
Balance sheets alone are powerful, but ratios make them actionable:
- Debt-to-Equity Ratio (D/E): Measures leverage. A higher ratio indicates riskier dependence on debt.
- Current Ratio: Current Assets / Current Liabilities. It shows liquidity.
- Quick Ratio: (Cash + Marketable Securities + Receivables) / Current Liabilities. A stricter measure of liquidity.
These ratios allow investors to quickly compare companies across industries.
Common Red Flags in a Balance Sheet
Not all balance sheets tell good stories. Red flags include:
- Rapidly increasing debt without revenue growth.
- Declining equity or negative retained earnings.
- Inventory buildup suggesting weak sales.
- High receivables turnover, indicating poor collection practices.
Spotting these warning signs can prevent costly mistakes.
Practical Example: Step-by-Step Analysis
Let’s imagine Company A:
- Assets: ₹300 crore
- Liabilities: ₹180 crore
- Equity: ₹120 crore
Step 1: Check liquidity. Current Assets of ₹50 crore vs Current Liabilities of ₹30 crore → Current Ratio = 1.67 (healthy).
Step 2: Examine debt. Debt-to-Equity = 180/120 = 1.5 → moderate risk.
Step 3: Look at equity growth. Retained earnings increased steadily in past 3 years → signals sustainability.
By breaking down each element, investors get a clear picture of financial health.
Expert Tips for Smarter Investment Decisions
- Compare across time: Look at trends, not just one balance sheet.
- Benchmark against peers: Ratios are meaningful when compared to industry averages.
- Focus on cash: Strong cash flow is always a good sign.
- Avoid red flags: Don’t ignore mounting debt or falling equity.
- Use balance sheet with income & cash flow statements: Together, they offer a full picture.
At Indiainvesthub, we empower investors with practical insights, tools, and expert guidance to simplify balance sheet reading. This enables smarter investment decisions backed by data and clarity.
Conclusion
Reading a balance sheet is more than interpreting numbers—it’s about understanding the financial story behind a company. By analyzing assets, liabilities, and equity, investors gain clarity on liquidity, debt levels, and ownership value. Ratios like debt-to-equity and current ratio further simplify comparisons, while spotting red flags helps avoid costly mistakes. A well-read balance sheet reveals both strengths and hidden risks, making it a vital tool for smarter investment decisions. With practice, investors can transform balance sheet analysis into a powerful habit that builds financial confidence.
are you ready to decode your next balance sheet like a pro?