

Technical Analysis is a crucial tool used by traders and investors to evaluate securities and forecast future price movements based on historical market data, primarily price and volume. Unlike fundamental analysis, which examines a company’s financial health and intrinsic value, technical analysis focuses on chart patterns, trends, and statistical indicators to make informed trading decisions.
This method has gained widespread acceptance for its ability to help investors time their entries and exits, manage risk, and improve overall market understanding.
Table of Contents
What is Technical Analysis?
Technical analysis is the study of past market data, mainly price and volume, to predict future price movements of stocks, commodities, currencies, and other tradable assets. The core belief underlying this approach is that historical price behavior tends to repeat itself due to the collective psychology of market participants.
Charts are the primary tool in technical analysis, revealing patterns and trends that signal potential buying or selling opportunities. Analysts use a variety of techniques such as trendlines, support and resistance levels, moving averages, and oscillators to interpret market sentiment.
History and Evolution of Technical Analysis
The roots of technical analysis date back to the early 20th century, credited largely to Charles Dow, who introduced concepts that later became the Dow Theory. Over the decades, this field has evolved to incorporate advanced mathematical tools and computer algorithms, allowing traders to analyze large datasets and generate precise signals.
Today, technical analysis integrates traditional charting techniques with modern software, making it accessible and widely used among retail and institutional investors alike.
Why Use Technical Analysis?
One of the primary advantages of technical analysis is its ability to provide timing insights. While fundamental analysis may tell investors what to buy, technical analysis often guides them on when to buy or sell. It helps traders identify momentum shifts, reversals, and breakouts, essential for maximizing profits and minimizing losses.
Additionally, technical analysis can be applied across various markets and timeframes, offering flexibility for day traders, swing traders, and long-term investors.
Key Tools and Techniques in Technical Analysis
Technical analysis uses a variety of tools and techniques to interpret market data and predict future price movements. Below are some of the most important tools every trader should know:
1. Charts
Charts are the foundation of technical analysis, providing a visual representation of price movements over time. The most common chart types include:
- Line Charts: Connect closing prices over time with a simple line, useful for seeing general trends.
- Bar Charts: Show open, high, low, and close prices (OHLC) for each time period, giving more detailed information.
- Candlestick Charts: Similar to bar charts but use colored bars (“candles”) that indicate price direction, making patterns easier to spot.
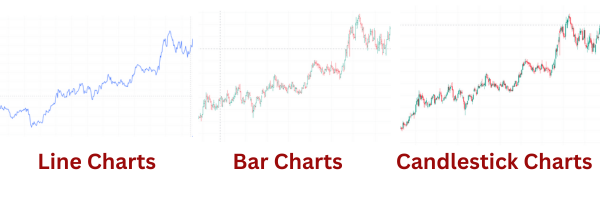
These charts help traders visualize trends, reversals, and consolidation phases.
2. Trendlines
Trendlines are straight lines drawn on charts to connect significant lows in an uptrend or highs in a downtrend. They help identify the direction and strength of a trend.
- Uptrend Line: Drawn by connecting rising lows; indicates increasing prices.
- Downtrend Line: Drawn by connecting falling highs; signals declining prices.
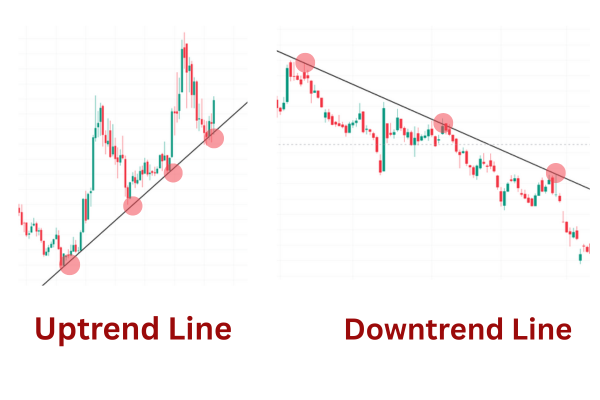
Trendlines act as support or resistance levels and help traders decide when to enter or exit trades.
3. Support and Resistance
Support and resistance levels are price points where an asset repeatedly stops falling (support) or rising (resistance).
- Support: A price floor where buying interest tends to emerge.
- Resistance: A price ceiling where selling pressure often increases.
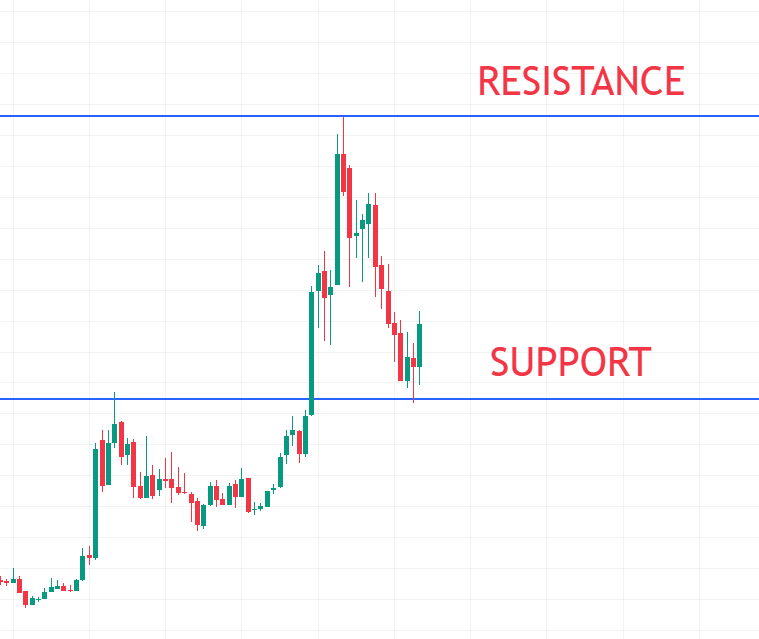
Identifying these levels allows traders to anticipate price reversals or breakouts, making them essential for setting stop-loss and take-profit orders.
4. Moving Averages
Moving averages smooth out price data to help identify trends by averaging prices over a specified period.
- Simple Moving Average (SMA): The average price over a fixed period.
- Exponential Moving Average (EMA): Gives more weight to recent prices, making it more responsive to new data.
Moving averages are often used to generate buy/sell signals, especially when a shorter-term average crosses above or below a longer-term average (known as a crossover).
5. Indicators and Oscillators
Indicators are mathematical calculations based on price and volume that help measure momentum, trend strength, and market volatility. Popular indicators include:
- Relative Strength Index (RSI): Measures momentum to identify overbought or oversold conditions.
- Moving Average Convergence Divergence (MACD): Shows trend direction and momentum by comparing moving averages.
- Bollinger Bands: Use standard deviations around a moving average to signal volatility and possible price breakouts.
Oscillators like RSI and MACD are especially useful in sideways markets to detect potential reversals.
6. Volume Analysis
Volume measures the number of shares or contracts traded during a given period. It is a critical tool to confirm trends and breakout strength.
- Increasing volume during an uptrend suggests strong buying interest.
- High volume at support or resistance levels can indicate the validity of those levels.
Volume indicators, such as On-Balance Volume (OBV), help traders understand the strength behind price movements.
How to Use Technical Analysis Effectively
To make the most of technical analysis, it’s important to follow a disciplined approach:
- Understand the Market Context: Know the asset you are trading and its typical behavior.
- Identify Trends: Determine if the market is trending or ranging.
- Use Multiple Indicators: Cross-check signals from different tools to avoid false alarms.
- Set Entry and Exit Points: Define clear levels for buying, selling, and stop-loss orders.
- Manage Risk: Use position sizing and risk management strategies to protect capital.
Regular practice and back-testing strategies on historical data are essential to developing proficiency in technical analysis.
Common Misconceptions about Technical Analysis
Despite its popularity, technical analysis faces criticism for being overly reliant on past data, which some argue may not predict future events accurately. Others believe it can lead to subjective interpretations, as chart patterns can be seen differently by various analysts. However, when combined with sound trading psychology and risk management, technical analysis remains a powerful framework for navigating market complexities.
Advantages of Technical Analysis
- Timely Entry and Exit Signals: Helps traders capitalize on short-term market movements.
- Universal Application: Works in stocks, forex, commodities, and cryptocurrencies.
- Visual Learning: Charts provide intuitive understanding of market behavior.
- Complements Fundamental Analysis: Offers an additional layer of insight.
Limitations of Technical Analysis
- Does Not Guarantee Success: Market unpredictability can cause unexpected outcomes.
- Requires Discipline: Emotional trading can undermine technical signals.
- Can Be Overwhelming: Too many indicators may confuse traders rather than help.
Real-World Applications of Technical Analysis
Technical analysis is widely used by different types of market participants—from day traders who make multiple trades per day, to long-term investors who want to time their entry points. Hedge funds and algorithmic trading firms also rely heavily on technical indicators integrated with machine learning models to generate automated trading signals.
Conclusion: Why Technical Analysis Matters for Your Investment Strategy
In summary, technical analysis offers valuable insights into market psychology and price behavior. It equips investors with tools to make informed decisions based on data patterns rather than speculation. Whether you’re a beginner or a seasoned trader, mastering technical analysis can enhance your ability to navigate volatile markets, optimize trade timing, and manage risk effectively.
For long-term success in the stock market, combining technical analysis with fundamental research and disciplined money management is the key.
Frequently Asked Questions (FAQs)
Q1: Who is the father of technical analysis?
Charles Dow is considered the father of technical analysis for developing the Dow Theory and founding the Wall Street Journal.
Q2: Is technical analysis 100% accurate?
Technical analysis is not 100% accurate; it helps identify trends and probabilities, but market movements can be unpredictable and influenced by news.
Q3: What is the main focus of technical analysis?
The main focus of technical analysis is to study price movements, trends, and volume patterns to predict future stock market behavior.


