
Fibonacci Extensions Explained: How Traders Predict Profit Targets and Manage Risk is all about turning market structure into a roadmap for exits. Many investors learn how to spot entries, but closing the trade with confidence is the real challenge. That’s where extensions come in. They take the natural rhythm of price swings and project them forward, helping traders estimate where momentum may slow down — and where profits can be taken before the crowd reacts.
At the same time, these levels act like signposts for risk control, showing where a move may have stretched too far or where a reversal could start building. Instead of guessing, traders use extensions to plan ahead with clearer expectations. For investors looking to grow more disciplined in trending markets, understanding Fibonacci extensions adds structure to decision-making — blending technical insight with practical trade management so exits aren’t left to emotion or luck.
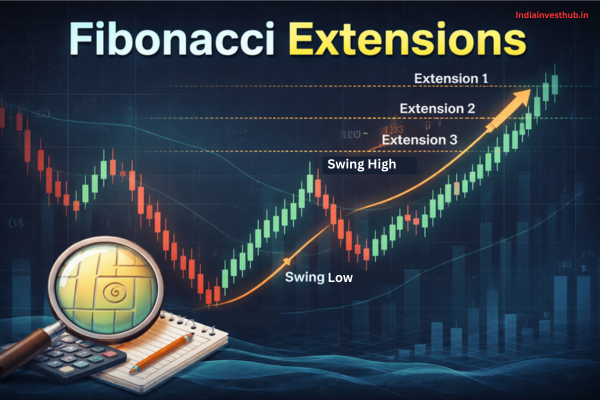
What Are Fibonacci Extensions?
Fibonacci Extensions are levels projected beyond the current price swing to help traders identify potential profit-taking areas in trending markets. While Fibonacci Retracement helps identify how far a pullback may go, Fibonacci Extensions show how far the next continuation wave may travel. They are derived from the same Fibonacci ratios found in mathematics, nature, architecture, and financial markets — ratios such as 123.6%, 161.8%, 200%, and 261.8%.
The logic is simple: if markets move in waves — impulse, pullback, continuation — then Fibonacci Extensions help measure the likely size of that continuation wave based on the prior move. Price often reacts near these extension levels because many traders, institutions, and algorithms watch them — leading to order clustering. According to Investopedia, Fibonacci tools are among the top-used methods for identifying support and resistance levels in modern trading.
How Fibonacci Extension Levels Are Calculated (123.6%, 161.8%, 200%, 261.8%):
The most commonly used Fibonacci Extensions are:
- 123.6% — shallow projection, often in consolidating trends
- 161.8% — the golden ratio, key continuation level
- 200% — a full doubling of the initial move
- 261.8% — strong extension, often in powerful trends
These levels come from mathematical relationships within the Fibonacci sequence. For example, 161.8% comes from dividing one Fibonacci number by the previous one as the sequence grows. Traders apply these ratios to market swings because price often moves in proportional waves driven by human behavior — such as momentum, trend-following, and herd psychology. In other words, Fibonacci Extensions help traders move from emotional decisions to measured projections.
Fibonacci Retracement vs Fibonacci Extensions: What’s the Difference?
Many traders confuse retracements with extensions, but they serve different purposes.
- Fibonacci Retracement measures how far a price pulls back within a trend
- Fibonacci Extensions project how far price may travel beyond the previous high or low
Retracement levels stay inside the prior swing range, while extension levels go beyond it. Think of retracements as identifying discount zones for entries, and extensions as defining target zones for exits. This is why advanced traders often use both together — retracements for entry timing and extensions for exit planning.
Fibonacci Retracement Explained: How Traders Use It to Find High-Probability Setups
How to Draw Fibonacci Extensions Correctly on Price Charts:
To plot Fibonacci Extensions accurately, traders typically:
- Select the swing low
- Select the swing high
- Then anchor the tool to the pullback low (in an uptrend)
Or reverse the process in a downtrend. This projects forward-looking levels that extend beyond the prior swing, providing visual markers for potential price targets.
A study published in the Journal of Trading highlights that traders who follow structured exit strategies — including Fibonacci-based targeting — tend to achieve more consistent results than those who exit emotionally or randomly, largely because exits become predefined instead of reactive.
Why the 161.8% Golden Ratio Is So Important in Profit Targeting:
Among all Fibonacci Extensions, 161.8% is considered the most powerful because it aligns with the golden ratio — a mathematical constant found repeatedly in growth patterns, structural design, and natural formations. Markets reflect crowd behavior, and when enough traders react to the same level, this increases the chance of price reacting there too.
Many professional traders — especially trend traders — use the 161.8% level as their primary profit target in strong directional moves. Not because Fibonacci causes movement, but because market participants structure orders around it, leading to self-reinforcing behavior. That’s why it’s common to see price stall, consolidate, or reverse near this level.
Using Fibonacci Extensions to Set Realistic Profit Targets:
One of the hardest parts of trading is knowing when to exit a winning trade. Retail traders often exit too early due to fear or too late due to greed. Fibonacci Extensions help define rule-based target areas such as:
- Conservative target → 123.6%
- Standard trend target → 161.8%
- Extended trend target → 200% or 261.8%
Having predefined targets reduces emotional pressure and supports risk-to-reward planning. Studies in behavioral finance show that structured exit rules significantly improve performance consistency compared to discretionary exits driven by emotion (Journal of Behavioral Finance).
Combining Fibonacci Extensions with Support, Resistance, and Trendlines:
Fibonacci Extensions become even more effective when they align with horizontal support-resistance, moving averages, psychological round numbers, or trendlines. Traders call this confluence — when multiple technical factors highlight the same price zone. Confluence matters because institutional traders often act at these levels, increasing the probability of reactions.
For example, a 161.8% extension aligning with a prior weekly resistance level creates a stronger reason to secure profits or tighten stops than Fibonacci alone. Confluence converts a simple Fibonacci level into a high-probability reaction zone.
Risk Management: Where to Place Stop-Loss When Trading Extensions
Fibonacci Extensions are not guarantees — they are probability tools. That’s why risk management is essential. Traders often place stop-losses:
- Below structure lows in uptrends
- Above structure highs in downtrends
- Beyond invalidation points rather than inside noise
The CFA Institute emphasizes that proper risk control is more important than strategy selection, and traders who risk a small percentage per trade tend to survive longer than those who don’t manage risk proactively.
Using Fibonacci Extensions for targets works best when stops are also structured, so trades have defined reward-to-risk ratios — such as 2:1 or greater.
Common Mistakes Traders Make with Fibonacci Extensions and How to Avoid Them:
Some frequent mistakes include:
- Drawing extensions on unclear swings
- Expecting Fibonacci levels to work every time
- Ignoring trend context
- Using Fibonacci without confluence
- Setting unrealistic targets
Another key error is using Fibonacci Extensions in choppy, sideways markets, where trend continuation probability is low. Extensions work best in trending environments where impulse-pullback-impulse structure is clear.
Pro Trading Strategies Using Fibonacci Extensions for Trend Trading:
Professional traders don’t rely on Fibonacci Extensions alone. They blend them into broader trading frameworks, such as:
Trend Continuation Strategy
- Identify trend direction
- Enter on retracement
- Use 138%–161.8% extension as primary profit target
Breakout Strategy
- Measure breakout impulse move
- Draw Fibonacci Extensions
- Use extension levels to stagger exits
Multi-Timeframe Analysis
- Plot higher-timeframe Fibonacci Extensions
- Execute entries on lower-timeframe pullbacks
These structured approaches help turn Fibonacci from a drawing tool into a strategic planning system.
FAQs – Fibonacci Extensions
Q1: Do Fibonacci Extensions guarantee price targets?
👉No — they highlight probability zones, not certainties.
Q2: Are Fibonacci Extensions useful for beginners?
👉Yes — especially for learning structured exits.
Q3: Can Fibonacci Extensions be used in all markets?
👉They are widely used across stocks, forex, commodities, and crypto.
Q4: What timeframe works best?
👉They work on all timeframes — but higher timeframes tend to be more reliable.
Q5: Do professional traders use Fibonacci?
👉Yes — many do, often alongside confluence tools and risk management frameworks.
Conclusion:
Fibonacci Extensions Explained: How Traders Predict Profit Targets and Manage Risk ultimately shows that exits don’t have to be emotional or improvised. By projecting the rhythm of prior price swings into the future, traders gain reference points for booking profits, scaling out of positions, or tightening risk when markets start to stretch. They’re not a crystal ball — price can and will behave unexpectedly — but extensions offer structure, consistency, and a framework for thinking ahead rather than reacting late. When combined with trend analysis, volume, and risk management, they help investors approach markets with greater discipline and confidence. The real edge comes not from the tool itself, but from how calmly and consistently you use it within your trading plan.
So, as you refine your strategy, the question becomes: will you let emotions drive your exits, or will you use Fibonacci extensions to plan them with intention?


