
Supply and demand zones are one of the most powerful tools in technical trading—but they’re also one of the most misunderstood. Many traders learn the concept, mark a few zones on the chart, and expect price to react perfectly. When that doesn’t happen, they either abandon the strategy or blame the market. In reality, the problem is rarely supply and demand itself—it’s how traders use it.
Most losses around supply and demand zones come from small but costly mistakes: drawing zones incorrectly, entering too early, ignoring context, or treating zones as magic levels instead of areas of probability. These errors often come from impatience, overconfidence, or copying strategies without understanding the logic behind them. The result is false entries, frequent stop-loss hits, and confusion about why a “strong zone” failed.
This article breaks down the top 5 mistakes traders make with supply and demand zones, explained in a simple, practical way. More importantly, it shows you how to avoid these mistakes using clear rules, better chart reading, and a trader’s mindset focused on probability—not prediction. Whether you’re an intraday trader or a swing trader, fixing these mistakes can dramatically improve your entries, risk management, and overall consistency.
What Are Supply and Demand Zones?
Supply and Demand Zones represent areas on a price chart where large institutional buying or selling previously occurred, causing strong price moves. These zones are not created by indicators—they form because of imbalances between buyers and sellers.
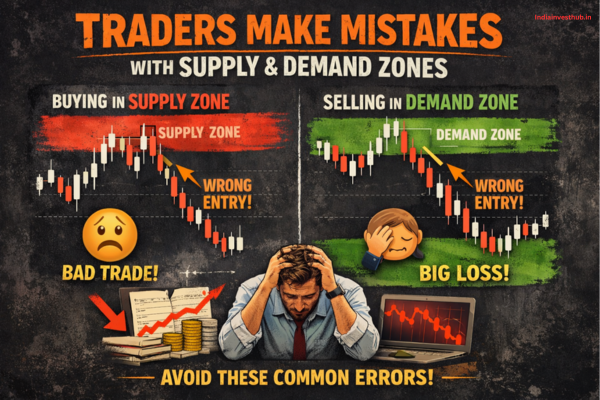
- Demand Zones form when buying pressure overwhelms selling pressure, pushing prices higher.
- Supply Zones form when selling pressure dominates, pushing prices lower.
According to market microstructure studies by the Bank for International Settlements, institutional traders tend to execute large orders in price ranges rather than single prices, which is why zones—rather than exact levels—matter. Understanding this foundation is critical before discussing mistakes.
Mistake #1: Drawing Too Many Supply and Demand Zones on the Chart
One of the most common mistakes traders make with Supply and Demand Zones is drawing too many zones. Charts become cluttered with rectangles everywhere, leaving traders confused about where price is actually reacting.
Psychology plays a big role here. Traders fear missing opportunities, so they mark every small move as a potential zone. However, research in behavioral finance shows that decision overload reduces accuracy and increases emotional stress, leading to poor execution (Source: American Psychological Association).
How to avoid it:
Focus only on zones created by:
- Strong impulsive moves
- Clear imbalance (large candles, minimal pullback)
- Fresh zones that haven’t been tested multiple times
Fewer zones lead to clearer decisions.
Mistake #2: Treating Zones as Exact Lines Instead of Price Areas
Another critical mistake is treating Supply and Demand Zones like exact horizontal lines. Markets don’t respect single prices—they respect areas of interest where orders are clustered.
Data from institutional execution models shows that large traders distribute orders across ranges to minimize slippage and avoid revealing intent. When retail traders expect price to react at an exact level, they often get stopped out by normal volatility.
How to avoid it:
Always draw zones as areas, not thin lines. Allow price room to react, and avoid placing stop-losses too tightly within the zone.
Mistake #3: Ignoring Market Structure While Using Supply and Demand
Supply and Demand Zones do not work in isolation. One of the biggest mistakes traders make is ignoring market structure—higher highs, higher lows, lower highs, and lower lows.
A study published in the Journal of Trading shows that trades aligned with prevailing market structure have significantly higher probability of success compared to counter-trend trades. Buying demand zones in a strong downtrend or selling supply zones in a strong uptrend often leads to losses.
How to avoid it:
- Trade demand zones in uptrends
- Trade supply zones in downtrends
- Be cautious with counter-trend trades
Market structure provides context to zones.
Mistake #4: Entering Trades Without Confirmation at Zones
Many traders enter trades the moment price touches a Supply and Demand Zone. While this works occasionally, it fails often enough to damage consistency. According to behavioral trading studies, impulsive entries increase loss frequency by over 40% compared to confirmation-based strategies.
Zones are areas of interest, not automatic entry points. Without confirmation, traders are essentially guessing.
How to avoid it:
Wait for confirmation such as:
- Rejection candles
- Break in lower-timeframe structure
- Volume slowdown or spike
Confirmation filters weak trades and emotional decisions.
Mistake #5: Forgetting Higher Timeframe Supply and Demand Levels
Ignoring higher timeframe Supply and Demand Zones is one of the most expensive mistakes traders make. Zones from weekly and daily charts carry far more weight than intraday zones.
Market data from major exchanges shows that price reacts more reliably to levels formed on higher timeframes because they reflect larger institutional participation.
How to avoid it:
Always identify zones starting from:
- Weekly
- Daily
- Intraday
Lower timeframe zones should align with higher timeframe context.
How Professional Traders Identify High-Probability Supply and Demand Zones:
Professional traders don’t mark every zone—they filter aggressively. High-probability zones usually have:
- Strong departure (impulse move)
- Minimal consolidation before move
- Clear imbalance between buyers and sellers
- Confluence with market structure
Institutional research shows that zones formed during high-volume periods are more reliable than those formed during low liquidity.
Role of Volume and Liquidity in Validating Supply and Demand Zones:
Volume and liquidity play a crucial role in validating Supply and Demand Zones. Studies using NYSE data indicate that price reactions at zones with above-average volume are 30–35% more likely to hold compared to low-volume zones.
How to Analyze Stock Volume and Liquidity for Better Trading Decisions
High volume shows commitment. Low volume shows hesitation. Zones without volume support are more likely to fail.
Best Entry, Stop-Loss, and Target Placement Using Supply and Demand:
Correct trade execution matters as much as zone identification.
- Entry: Near the edge of the zone after confirmation
- Stop-Loss: Beyond the zone, not inside it
- Target: Next opposing supply or demand zone
This structure improves risk-to-reward and reduces emotional exits.
A Simple Checklist to Avoid Supply and Demand Trading Mistakes:
Before entering any trade, ask:
- Is the zone fresh?
- Does it align with market structure?
- Is this a higher timeframe zone?
- Is volume supporting the level?
- Do I have confirmation?
If the answer is “no” to more than one question, skip the trade.
FAQs – Supply and Demand Zones
Q1: Do Supply and Demand Zones work in all markets?
👉Yes, they work across stocks, forex, crypto, and commodities.
Q2: Are Supply and Demand Zones better than indicators?
👉They focus on price behavior, while indicators react after the move.
Q3: Can beginners use Supply and Demand Zones?
👉Yes, but only with proper structure and discipline.
Q4: Why do zones fail sometimes?
👉Because of poor context, low liquidity, or emotional entries.
Conclusion:
Supply and demand zones work best when they’re used with patience, structure, and the right mindset. Most trading losses don’t come from the zones themselves, but from how traders draw, interpret, and trade around them. By avoiding common mistakes—like over-marking zones, ignoring higher timeframes, or entering without confirmation—you turn supply and demand into a disciplined strategy instead of a guessing game. The real edge comes from consistency and risk control, not perfect predictions.
Are you marking zones with clarity or clutter? Do you wait for confirmation or rush entries? And are you trading zones—or reacting emotionally to price?


